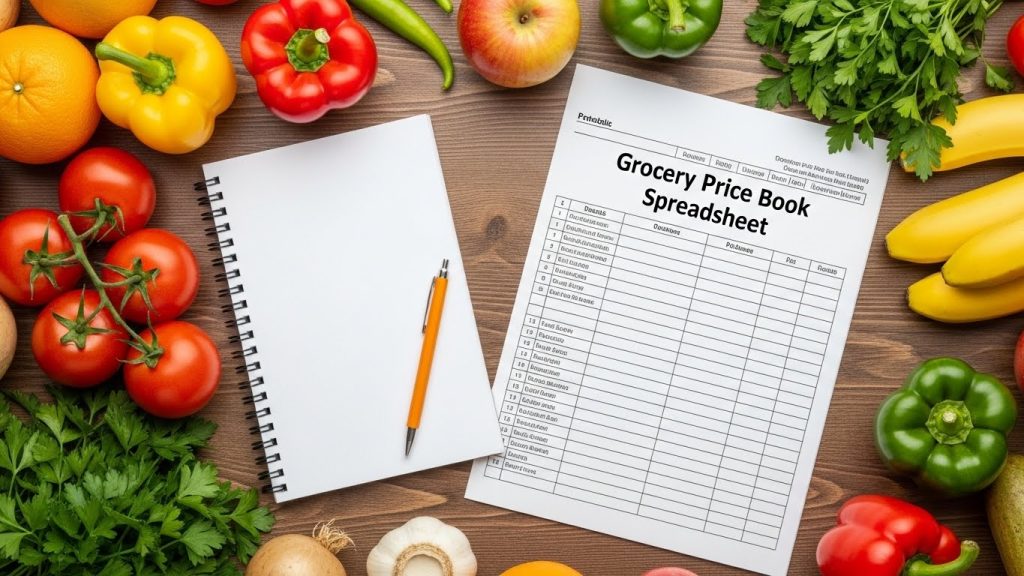
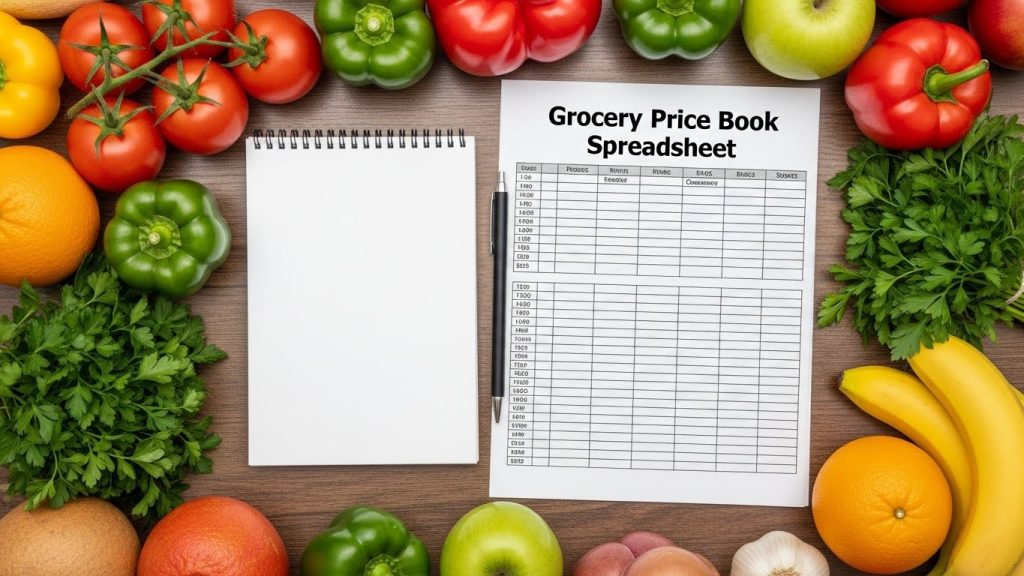
Master Grocery Price Book Spreadsheet
A Grocery Price Book Spreadsheet is a simple tracking tool that records item prices across stores, helping shoppers compare costs, spot trends, and find the best deals to cut grocery spending and stay on budget.
Key Takeaways On A Grocery Price Book Spreadsheet
- A grocery price book spreadsheet can save you 15-40% on grocery bills by helping you identify genuine sales and best prices across different stores
- Tracking unit prices rather than just package prices reveals the true value of deals and prevents marketing tricks from affecting your purchasing decisions
- Most stores operate on predictable 6-12 week sales cycles that you can leverage once you’ve collected enough data
- Vertex42 offers free customizable grocery price book templates that can be used immediately to start tracking prices
- Maintaining your price book requires just 5-10 minutes weekly but can save hundreds of dollars monthly for a typical household
Ever grabbed that “2 for $5” deal only to discover later it was actually more expensive than last month’s regular price? That’s exactly why savvy shoppers use grocery price book spreadsheets.
Grocery prices have increased by nearly 20% in the past two years, making it more crucial than ever to track what you’re paying. A price book spreadsheet isn’t just a shopping tool — it’s your financial defense system against clever marketing tactics and your ticket to genuine savings. I’ve been maintaining one for over five years, and it’s consistently saved my family between $200-300 monthly on groceries without compromising on quality or variety.
With Vertex42’s free grocery price book templates, you can start tracking prices immediately without creating a spreadsheet from scratch. Their customizable formats work with Excel, Google Sheets, and other spreadsheet programs, giving you flexibility while providing the structure needed for effective price tracking.
Why a Grocery Price Book Spreadsheet Will Transform Your Shopping
The difference between casual shopping and strategic shopping lies in data. Without tracking prices, you’re essentially guessing whether that “sale” sign represents actual savings. A grocery price book spreadsheet eliminates the guesswork by giving you your own personal price history database. Once I began tracking prices consistently, I discovered that nearly 30% of advertised “sales” at my local stores weren’t deals at all—just regular prices with flashy marketing.
Track Prices Across Multiple Stores
Do you shop at multiple stores but struggle to remember which items are cheaper where? A price book solves this problem instantly. By recording prices from different stores in one central location, you’ll quickly identify patterns. For instance, my spreadsheet revealed that while Aldi offered the best prices on dairy and produce, my local Kroger consistently beat them on canned goods and baking supplies. This knowledge alone saved me from overpaying by about 15% each month by strategically splitting my shopping between stores.
Identify True Sales vs. Regular Prices
One of the most eye-opening benefits of maintaining a price book is distinguishing between actual sales and marketing tricks. Stores frequently raise prices slightly before putting items “on sale,” creating the illusion of savings. With historical price data at your fingertips, these tactics become transparent. I’ve caught my local grocery chain advertising “30% off” cereal that was actually only 5% below its regular price from two weeks earlier. Your price book becomes your truth detector in a world of misleading sales tags.
Save 15-40% on Your Grocery Bill
The bottom-line impact of a well-maintained price book is substantial. Most families can expect to save between 15-40% on their grocery bills without changing what they buy—just when and where they buy it. These savings come from three main sources: buying at true sale prices, knowing which store offers the best regular prices on specific items, and recognizing sales cycles to stock up at optimal times. For my family of four, this translated to annual savings of over $3,000—enough to fully fund a vacation just by shopping smarter, not differently.
Real Savings Example: After tracking cereal prices for just two months, I discovered the price of our favorite brand fluctuated between $2.99 and $5.49. By only purchasing when prices dipped below $3.50 and buying enough to last until the next sale (typically 6 weeks later), we saved $125 annually on this single item alone.
Setting Up Your Price Book Spreadsheet
Creating an effective price book doesn’t require advanced spreadsheet skills—just a thoughtful structure. The key is balancing detail with usability. You’ll want enough information to make informed decisions without making the system so complex you’ll abandon it after a week.
Free Templates vs. DIY Options
When starting your price book journey, you have two main options: using a pre-made template or creating your own from scratch. Pre-made templates like those from Vertex42 provide immediate structure with properly formatted columns and calculations already set up. This option saves significant time and prevents common organizational mistakes. DIY spreadsheets offer maximum customization but require more initial setup time. For beginners, I strongly recommend starting with a template and modifying it as you learn what works best for your shopping habits.
Essential Columns to Include
An effective grocery price book needs certain fundamental columns to track the right data. At minimum, include: item name, brand, size/quantity, store name, regular price, sale price, date, and unit price. The unit price column is particularly crucial—it converts everything to a standard measurement (like price per ounce or per item) so you can make accurate comparisons between different package sizes and brands. Without tracking unit prices, you might miss that the 12oz package at $2.99 is actually more expensive per ounce than the 32oz package at $7.49.
In my experience, adding a few supplementary columns makes your price book even more powerful. Consider including: sale frequency (how often the item goes on sale), lowest historical price (so you know when you’ve found an exceptional deal), stock-up quantity (how many to buy when the price hits your target), and notes (for special considerations like coupon availability). These extra columns transform your price book from a simple tracking tool into a strategic shopping assistant.
| Essential Column | Purpose | Example |
|---|---|---|
| Item Name | Clear identification | Cheerios Cereal |
| Brand | Compare across brands | General Mills |
| Size/Quantity | Package information | 18 oz box |
| Store | Location tracking | Kroger |
| Regular Price | Non-sale baseline | $4.99 |
| Sale Price | Special pricing | $2.99 |
| Date | Track price changes | 5/15/2023 |
| Unit Price | Standardized comparison | $0.17/oz |
Digital vs. Printable Format Pros and Cons
Both digital and printable price books offer distinct advantages. Digital versions (using Excel, Google Sheets, or apps) allow for automatic calculations, easy updates, accessibility across devices, and simple sorting/filtering. I personally use Google Sheets because I can access my price book from my phone while standing in store aisles and share it with my spouse so we’re both working from the same data. Digital formats also make it easier to analyze price trends over time through charts and graphs.
Printable versions, on the other hand, never run out of battery, don’t require internet access, and can be easily referenced at a glance. Some people also find the physical act of writing prices helps with memory retention. The downside is manual calculations and the need to rewrite information when pages get full. If you’re new to price books, I suggest starting with a digital version with the option to print specific sections when needed for shopping trips.
Time-Saving Setup Strategies
Setting up your initial price book doesn’t have to be an overwhelming project. Start with just 10-15 items you purchase most frequently—this creates a foundation you can build upon gradually. For maximum efficiency, create your basic spreadsheet structure before your next shopping trip, then add your first batch of items from that trip’s receipt. This approach provides immediate value while spreading the setup work over several weeks rather than attempting to catalog everything at once.
Another time-saving strategy is to divide data entry responsibilities if you shop with a partner or family members. In my household, I maintain the spreadsheet structure and formulas, while my spouse often adds new price data after shopping trips. This division of labor has made our price book more sustainable long-term, as no single person feels burdened with all the maintenance work.
What Data to Track for Maximum Savings
The right data points transform a simple list into a powerful savings tool. While it might be tempting to track everything, focus on information that directly impacts your buying decisions.
Store Name and Location
Record not just the store chain but the specific location whenever possible. Price variations between branches of the same chain can be surprisingly significant. I discovered a 15% average price difference between two Walmart locations just 8 miles apart from each other. This knowledge has changed my shopping routes on days when I have time to drive slightly farther for better prices.
For online shopping, note whether prices came from pickup, delivery, or in-store shopping, as these can differ substantially. Many stores now charge premium prices for delivery orders compared to in-store purchases, sometimes 10-20% higher on identical items. For a comprehensive guide on tracking grocery prices, check out this grocery list template.
Exact Product Details
Precision matters when tracking products. Record the exact brand, variety, and size to ensure you’re comparing apples to apples. “Heinz Ketchup, 32oz bottle” provides much more useful data than simply “ketchup.” This specificity prevents confusion when analyzing prices later and helps identify when manufacturers employ “shrinkflation”—reducing product sizes while maintaining prices.
For store brands or generic products, note the quality tier if applicable (e.g., “Kroger Premium” vs. “Kroger Value”). These distinctions matter when evaluating whether a name brand on sale beats the regular price of a store brand equivalent.
Regular and Sale Prices
Always distinguish between an item’s regular price and sale price in your spreadsheet. This distinction is crucial for identifying true deals and understanding price cycles. I use separate columns for each, plus a simple formula that calculates the percentage discount. This calculation instantly shows whether that “Special!” tag represents a significant saving or a minor markdown not worth a special trip.
When possible, note any conditions attached to the sale price, such as “Buy 5, Save $5” promotions or digital coupon requirements. These details help evaluate whether the deal is accessible for your shopping habits.
Unit Price Calculations
Unit prices are the great equalizer in grocery shopping, revealing the true cost of items regardless of package size. While many store shelf labels include unit prices, they’re often inconsistent across products (mixing per-ounce and per-pound measurements). Your spreadsheet should convert everything to the same measurement unit for honest comparisons. For a practical tool, consider using a Google Sheets grocery list template to help with these calculations.
Calculating Unit Price: Regular Price ÷ Unit Quantity = Unit Price
Example: $3.49 ÷ 16 oz = $0.218 per ounce
This simple calculation has saved me countless dollars by exposing “value size” packages that actually cost more per unit than smaller packages. Once, I found that a “family size” cereal box at $5.99 cost $0.21 per ounce, while the “regular” box on sale at $2.99 cost only $0.17 per ounce—a 19% difference hidden by clever packaging.
Sale Cycle Patterns
Most grocery items follow predictable sales cycles, typically ranging from 6-12 weeks depending on the product category. By tracking dates alongside prices, patterns emerge that allow you to predict future sales. This knowledge transforms reactive shopping into proactive planning. After maintaining my price book for about three months, I could accurately predict when paper products would hit their lowest prices, allowing me to stock up at the optimal time rather than paying premium prices when we ran out.
Organizing Your Price Book by Categories
A well-organized price book makes shopping decisions faster and maintenance simpler. Structure matters almost as much as the data itself. After years of refinement, I’ve found category-based organization provides the best balance of usability and comprehensiveness.
Food Category Breakdown
Breaking down food items into logical categories dramatically improves your price book’s usability. I recommend starting with these essential categories: dairy, meat/protein, produce, grains/bread, frozen foods, canned goods, snacks, and beverages. This structure mirrors how most stores organize their layouts, making it easier to update your price book as you shop. Within each category, consider subcategories for frequently purchased items – for instance, separating cheese, milk, and yogurt within your dairy section.
The key is finding the right balance of detail. Too many categories make your spreadsheet unwieldy, while too few make it difficult to find specific items. I started with eight main categories and expanded to twelve as my tracking became more sophisticated. For those looking to streamline their grocery tracking, a grocery list template can be a helpful starting point. Your optimal structure will depend on your family’s eating habits and shopping patterns.
Household and Cleaning Supplies
Household items often represent significant savings opportunities because their prices fluctuate dramatically and they have long shelf lives. Create dedicated sections for laundry supplies, cleaning products, paper goods, and general household items. These categories benefit from detailed tracking because the sales cycles tend to be longer (often 8-12 weeks), making it essential to stock up during genuine sales.
I discovered that laundry detergent at my local stores routinely varies between $7.99 and $15.99 for the same size – a 100% price difference! With this knowledge, I never pay full price and buy enough during sales to last until the next discount period. This approach has cut my cleaning supply expenses by nearly 40% annually.
Personal Care Items
Personal care products warrant their own dedicated section with subcategories for dental care, hair care, skin care, and other essentials. These items feature some of the most dramatic price swings in the entire store. My price book revealed that name-brand shampoo fluctuated between $2.99 and $8.99 throughout the year – knowledge that saves my family over $200 annually just on hair care products.
For these items, I recommend adding a “stock-up price” column in your spreadsheet that indicates the threshold price that should trigger a larger purchase. When tracking shows that toothpaste hits $1.00 or below only a few times yearly, for instance, that becomes my signal to buy enough to last 3-4 months.
Custom Categories That Match Your Shopping Habits
Beyond standard categories, create custom sections that reflect your family’s unique purchasing patterns. If you have pets, a dedicated pet supplies category is essential. If you buy specialty foods like gluten-free products or organic items, group these together to better track their specific price patterns. My family’s “specialty foods” category has revealed that these items follow completely different sales cycles than their conventional counterparts – often with deeper discounts but less frequent sales.
Don’t hesitate to adjust your categories over time as your shopping habits evolve. I reorganized my entire spreadsheet after six months once I better understood which groupings made the most sense for our shopping patterns. The time invested in this reorganization paid dividends in easier maintenance and clearer insights.
5 Ways to Collect Price Data Efficiently
The most common reason price books get abandoned is the perception that data collection is too time-consuming. These proven strategies make the process manageable and sustainable.
1. Save and Use Store Receipts
Store receipts are data gold mines for your price book. Rather than trying to record prices while shopping (which can be time-consuming and error-prone), simply collect your receipts and enter the data when convenient. I dedicate 10 minutes after unpacking groceries to update my spreadsheet with the latest prices. This approach ensures accuracy since receipts contain exact prices, item descriptions, and purchase dates – all essential data points for your price book.
For maximum efficiency, highlight the items you want to track before entering them, focusing on your most-purchased products rather than trying to log every single item. Many stores now offer digital receipts via email, which you can copy directly into your spreadsheet, saving even more time.
2. Take Photos While Shopping
When you spot interesting prices but aren’t purchasing the items, quickly snap photos of the price tags or shelf labels. This technique is particularly useful for comparison shopping or tracking competitors’ prices on your regular items. Modern smartphones make this process nearly instantaneous, and the photos capture all relevant details including unit prices, size information, and any special sale conditions.
I created a dedicated photo album on my phone just for price tracking, which I review weekly when updating my spreadsheet. This visual approach has helped identify pricing trends I might have missed through receipts alone, particularly for items I purchase less frequently but want to track for potential savings opportunities.
3. Use Store Apps and Weekly Ads
Most major grocery chains now offer apps that display current prices, often personalized to your local store. These digital tools provide a treasure trove of pricing data you can harvest without physically visiting the store. Similarly, weekly digital ads (often available through the same apps) allow you to track price changes across multiple stores quickly.
I check three store apps each weekend, focusing only on my commonly purchased items and significant sales on staples. This 5-minute routine has repeatedly identified unexpected price drops that prompted strategic stock-up shopping trips. The digital approach also allows for easy price comparison between competing stores without driving to multiple locations.
4. Start Small with Most-Purchased Items
The most effective approach to building your price book is starting with the 20-30 items your household purchases most frequently. These core items typically represent 70-80% of your potential savings opportunities. My family began with just 25 items—our weekly essentials like milk, eggs, bread, and paper products. Within just three weeks, this focused approach had already saved us $47 compared to our previous shopping patterns.
Once you’ve established consistent tracking for these core items, gradually expand your list. Add 5-10 new items monthly until you’ve covered most of your regular purchases. This incremental approach prevents the overwhelming feeling that causes many price books to be abandoned before they deliver value.
5. Create a Simple Data Collection Routine
Sustainability comes from routine. Designate specific times for price book updates and treat them as non-negotiable appointments. I update our price book every Sunday evening while planning the coming week’s meals and shopping list, which creates a natural workflow connection between the two activities. This regular schedule ensures the data remains current without becoming a burden.
Consider involving other household members in data collection. My spouse and teenage daughter both contribute to our price tracking, which distributes the workload while increasing everyone’s price awareness. Even young children can help by circling items on receipts or reading prices aloud while you enter the data.
Using Your Price Book While Shopping
A price book delivers value only when it actively influences your purchasing decisions. Integrate it into your shopping routine for maximum impact.
Pre-Shopping Price Comparison
Before heading to the store, consult your price book alongside weekly ads to identify genuine deals. This pre-shopping review takes just 5-10 minutes but dramatically increases your savings potential. I compare my shopping list against current sales and my recorded price history to determine which items are at true low prices versus regular pricing with “sale” labels. This simple practice has repeatedly prevented me from being lured by flashy sales signs for items priced higher than they were a few weeks earlier.
During this review, identify which store offers the best overall value for your current shopping list. Sometimes, splitting your shopping between two stores yields substantial savings, especially for major shopping trips. My data showed that for our typical monthly stock-up trip, visiting two specific stores saved us an average of $42 compared to shopping at either one exclusively.
Setting “Buy Price” Thresholds
Once you’ve collected several weeks of data, establish “buy price” thresholds for your staple items – the price point at which you’ll stock up regardless of immediate need. These thresholds become your shopping triggers and remove the guesswork from buying decisions. In my spreadsheet, I highlight these prices in green, making it instantly obvious when a current sale hits my stock-up threshold.
For non-perishable items with good storage life, I typically set the buy price at 30% below the average price. When peanut butter hits $1.99 versus its typical $3.49 price point, for instance, I’ll buy enough to last until the next expected sale. This systematic approach prevents both overpaying during need-based shopping and overbuying during sales.
Combining Price Knowledge with Coupons
Your price book becomes exponentially more powerful when combined with strategic coupon usage. Note in your spreadsheet which items frequently have manufacturer or digital coupons available. When these items also hit their sale cycle low point, the combined savings can reach 50-70% off regular pricing. I track coupon availability patterns in my price book’s notes column, which has helped identify predictable coupon cycles for certain brands.
Digital store coupons have become particularly valuable in this strategy. Many store apps now offer personalized discounts based on purchase history. By tracking both the base sale price and available coupon discounts in your price book, you can identify optimal purchase timing. Last month, this combined approach allowed me to purchase laundry detergent at an effective cost of $2.49 instead of its regular $11.99 price – a 79% savings by timing both the sale cycle and available coupon.
Mobile Access Options
Having your price data accessible while shopping transforms your price book from a planning tool to an in-the-moment decision assistant. Cloud-based spreadsheet options like Google Sheets provide instant access from your smartphone, allowing price checks while standing in the store aisle. When evaluating an unplanned sale item, you can immediately determine if it represents true value compared to historical prices.
If you prefer a physical price book, create condensed reference cards for your most-purchased items with their typical price ranges and buy-price thresholds. These pocket-sized references provide essential information without requiring technology at the store. I maintained a small notebook with this information before transitioning to a digital system, and it served effectively as a quick reference guide during shopping trips.
Advanced Price Book Features to Include
Once you’ve mastered basic price tracking, consider adding these advanced features to extract even more value from your data. Each enhancement transforms your price book from a simple tracking tool into a comprehensive shopping intelligence system that continuously improves your purchasing decisions.
Price Trend Charts
Visual representations of price changes reveal patterns that might be missed in data tables alone. Most spreadsheet programs allow you to create simple line charts showing how prices fluctuate over time. These visualizations make it immediately obvious when prices are trending upward, helping you decide whether to stock up now or wait for a better sale. I created quarterly charts for our top 20 most expensive grocery categories, which revealed that paper products consistently hit their lowest prices in April and September – knowledge that has shaped our bulk-buying strategy.
For frequently purchased items, consider creating rolling 12-month charts that clearly show seasonality and general price trends. This longer-term view provides context for current prices and helps distinguish between normal fluctuations and concerning inflation on specific products. My cereal price trend chart revealed that despite occasional deep sales, the overall price had increased by 22% over 18 months – information that prompted us to explore more economical breakfast alternatives.
Seasonal Price Fluctuation Notes
Many grocery items follow predictable seasonal pricing patterns that your price book can help identify. Create a dedicated section or column for noting these seasonal trends. This might include when certain produce items hit their price lows, when holiday-related items see steep discounts, or when back-to-school supplies affect pricing on lunch ingredients. My notes show that frozen vegetables reach their best prices in March, while canned goods hit annual lows in November – insights that guide our stocking schedule.
These seasonal insights become particularly valuable for planning major purchases. By knowing that turkey prices drop dramatically the week after Thanksgiving, for instance, you can plan to buy extra for freezing. Similarly, tracking reveals that sunscreen prices peak in May-June but often drop by 40% or more in September, making that an ideal time to stock up for the following year if storage space allows.
Stockpile Calculator
A stockpile calculator helps determine exactly how much to buy when prices hit their lows. This simple formula considers your usage rate, storage capacity, product shelf life, and expected time until the next sale. For instance, if your family uses two jars of pasta sauce monthly, the item has a 12-month shelf life, sales occur quarterly, and you have adequate storage, your ideal purchase quantity during sales would be six jars – enough to last until the next expected sale with a small buffer.
I’ve implemented this calculator as a simple formula in my spreadsheet that multiplies our monthly usage by the weeks until the next expected sale (based on historical data), then adds a 25% buffer. This prevents both overbuying (which ties up money and storage space) and underbuying (which forces full-price purchases between sales). For my family, this precise approach to stock-up shopping has eliminated almost all between-sale emergency purchases at regular prices.
Savings Tracker
Quantify your success by tracking actual savings achieved through price book-informed shopping. This motivational feature shows the concrete benefits of your efforts and helps refine your strategy. Create a simple system that compares what you actually paid versus what you would have paid at average prices. My savings tracker includes:
- Weekly savings total (compared to average prices)
- Monthly savings summary
- Year-to-date savings
- Highest-saving categories (showing where your strategy works best)
- Time investment log (tracking minutes spent maintaining the price book)
This tracking revealed that our family saves approximately $320 monthly through strategic shopping, representing a 28% reduction in our grocery spending compared to before using a price book. When calculated against the roughly 2 hours monthly I spend maintaining our system, this represents an equivalent “hourly wage” of $160 – a return on investment few other activities can match.
The psychological benefit of seeing these savings accumulate cannot be overstated. During months when price tracking feels tedious, reviewing our annual savings (which funded a family vacation last year) provides powerful motivation to maintain the habit.
My Price Book Spreadsheet Maintenance System
The key to long-term price book success is establishing a sustainable maintenance routine. Based on years of refining my approach, I’ve developed a three-tiered system that balances thoroughness with practicality. This system keeps data current without becoming burdensome, ensuring your price book remains a valuable tool rather than an abandoned project.
Weekly Quick Updates (5 Minutes)
Dedicate 5-10 minutes weekly to input new prices from recent shopping trips. Focus exclusively on items already in your tracking system, entering current prices whether they’ve changed or not. This consistent recording of data points, even when prices remain stable, provides valuable confirmation of price patterns. I complete this quick update every Sunday evening while planning the coming week’s meals, which creates an efficient workflow connecting the two related tasks.
To streamline this process, keep a dedicated folder (physical or digital) for receipts you haven’t yet processed. Some price book users take photos of their receipts immediately after shopping and delete them once entered into their spreadsheet. Whatever system you choose, the key is consistency – even five minutes weekly will maintain your price book’s accuracy for decision-making purposes.
Monthly Deep Reviews
Once monthly, schedule 20-30 minutes for a more comprehensive review and analysis of your price book data. This session serves three purposes: adding new items to track, identifying emerging price trends, and refining your buy-price thresholds based on the latest data. During this review, I examine price trends across categories, update any seasonal notes, and identify which items are approaching their typical sale cycle timing – information that directly shapes the following month’s shopping strategy.
This monthly review is also the perfect time to calculate and record your actual savings. Seeing concrete evidence of your price book’s impact provides powerful motivation to continue the practice. My spreadsheet automatically calculates the difference between what we paid versus average prices, giving us a precise monthly savings figure that reinforces the value of our system.
Handling Price Increases
In today’s inflationary environment, addressing rising prices is an essential aspect of price book maintenance. When you notice consistent price increases on staple items, update your buy-price thresholds accordingly. Rather than using fixed dollar amounts, consider percentage-based thresholds (e.g., “buy when 25% below average price”) that automatically adjust to market conditions. For items showing significant inflation, research alternatives or bulk-buying options and note these in your spreadsheet.
I’ve added a simple color-coding system to flag items experiencing rapid price inflation. Products with price increases exceeding 10% in three months get highlighted in red, prompting us to seek alternatives or substitutes. This visual system helps identify categories where our shopping habits need adjustment to maintain our budget targets despite rising prices. For a structured approach, you might consider using a grocery list template to track and manage your expenses effectively.
Frequently Asked Questions About Grocery Price Book Spreadsheet
After helping dozens of friends and family members establish their own grocery price books, I’ve encountered certain questions repeatedly. These practical concerns reflect common challenges in implementing and maintaining an effective price tracking system.
The most important thing to remember is that any price tracking, even if imperfect or incomplete, will yield better results than shopping without price awareness. Start small, be consistent, and watch your savings grow as your system evolves.
How much time does it take to maintain a grocery price book?
Effective price book maintenance typically requires 5-10 minutes weekly for basic updates plus 20-30 minutes monthly for deeper analysis. The initial setup takes longer – usually 1-2 hours to create your spreadsheet structure and enter your first batch of items. However, this investment yields returns almost immediately as you begin identifying true sales and optimizing purchases. My experience shows that for every hour spent maintaining a price book, the average household saves $75-150 in actual grocery expenditures.
To minimize time investment, start with tracking just your top 20 most frequently purchased items. This focused approach delivers the majority of potential savings while requiring minimal time commitment. As you become more efficient with the process, you can gradually expand your tracking to include more items.
Can I use a price book if I shop at different stores each week?
Not only can you use a price book while shopping at multiple stores, but this scenario actually maximizes your potential savings. By tracking prices across different retailers, you’ll quickly identify which store consistently offers the best value for specific categories. This knowledge allows for strategic shopping – purchasing each item where it’s typically cheapest or waiting for sales at your preferred location.
In your spreadsheet, create a clear way to distinguish between stores, either with separate columns for each major retailer or by including the store name with each price entry. Some price book users color-code entries by store for visual comparison. The key is being able to quickly identify price differences between retailers for your commonly purchased items.
| Item | Kroger Regular | Kroger Sale | Walmart Regular | Aldi Regular | Best Buy At |
|---|---|---|---|---|---|
| Milk, 1 gallon | $3.79 | $2.99 | $3.48 | $2.89 | Aldi |
| Eggs, dozen large | $3.29 | $1.99 | $2.97 | $2.19 | Kroger (sale) |
| Pasta sauce, 24oz | $2.49 | $1.49 | $1.98 | $1.89 | Kroger (sale) |
My multi-store price book revealed that our typical shopping list was cheapest when split between two primary stores, with occasional purchases at a third specialty store. This knowledge alone reduced our monthly grocery spending by 18% without changing a single item we purchased.
How do I handle items that come in different sizes at different stores?
Size variations across stores present a common challenge that unit pricing solves effectively. Always record both the total price and the unit price (price per ounce, pound, count, etc.) in your spreadsheet. This standardized measurement allows for accurate comparisons regardless of package size differences. Most spreadsheet programs can automatically calculate unit prices using simple formulas – divide the total price by the number of units to get your comparable metric.
For maximum clarity, standardize your unit measurements within categories. Use price per ounce for most packaged foods, price per pound for meat and produce, and price per item for things like paper goods. This consistency makes quick comparisons possible without mental conversion. My spreadsheet uses conditional formatting to highlight the lowest unit price across different package sizes and stores, making optimal choices immediately obvious.
Should I track prices of fresh produce and meat in my price book?
While fresh produce and meat prices fluctuate more than shelf-stable items, tracking them still provides valuable insights. Rather than expecting precise predictions, look for seasonal patterns and general price ranges. For produce, track monthly average prices to identify seasonal lows. For meat, record both regular prices and sale prices to recognize genuine deals when they appear. My produce tracking revealed that certain items have predictable price cycles – bell peppers reach their lowest prices in August and September, for instance – knowledge that has shaped our meal planning and freezing strategy.
Is there an app that can do this automatically for me?
While several apps offer price tracking features (including Basket, Flipp, and ShopSavvy), none currently provide the comprehensive analysis and personalization of a custom spreadsheet. Most apps focus on current prices or available deals rather than historical tracking. Some require barcode scanning, which limits tracking to items you’ve purchased. The most effective approach combines app-based current price checks with your own spreadsheet for historical tracking and pattern recognition.
App Recommendation: If you’re looking for a simplified starting point, try the free Basket app to compare current prices across local stores. While not a complete replacement for a price book, it provides a helpful supplement for immediate price comparisons while you build your comprehensive tracking system.
For those who prefer digital solutions but want more control than apps provide, Google Sheets offers an excellent compromise – it’s accessible from any device, can be shared with family members, and allows customization while providing powerful calculation capabilities. The combination of Google Sheets with receipt-scanning apps like Expensify can streamline data entry while maintaining analytical capabilities.
Remember that price awareness itself is the most powerful tool. Even an imperfect tracking system will dramatically improve your grocery budget compared to shopping without price knowledge. Start simple, be consistent, and watch your savings grow as your system evolves. For a more structured approach, consider using a grocery list template to keep track of prices and items efficiently.


Creating and maintaining a grocery price book spreadsheet represents one of the highest-return financial activities available to most households. The system transforms grocery shopping from a reactive necessity into a strategic opportunity to build savings without sacrifice. By knowing when and where to buy each item on your list, you’re leveraging information in a way most shoppers never do.
The cost of not having a grocery price book spreadsheet is far greater than the small investment in a proven system. Make the logical decision today: download the Ultimate Cash Savings Toolkit, containing Savvy Shopping Tips, and Cooking On A Budget, and save more in your first week than the cost of the entire bundle. It’s the only investment that pays you back immediately.